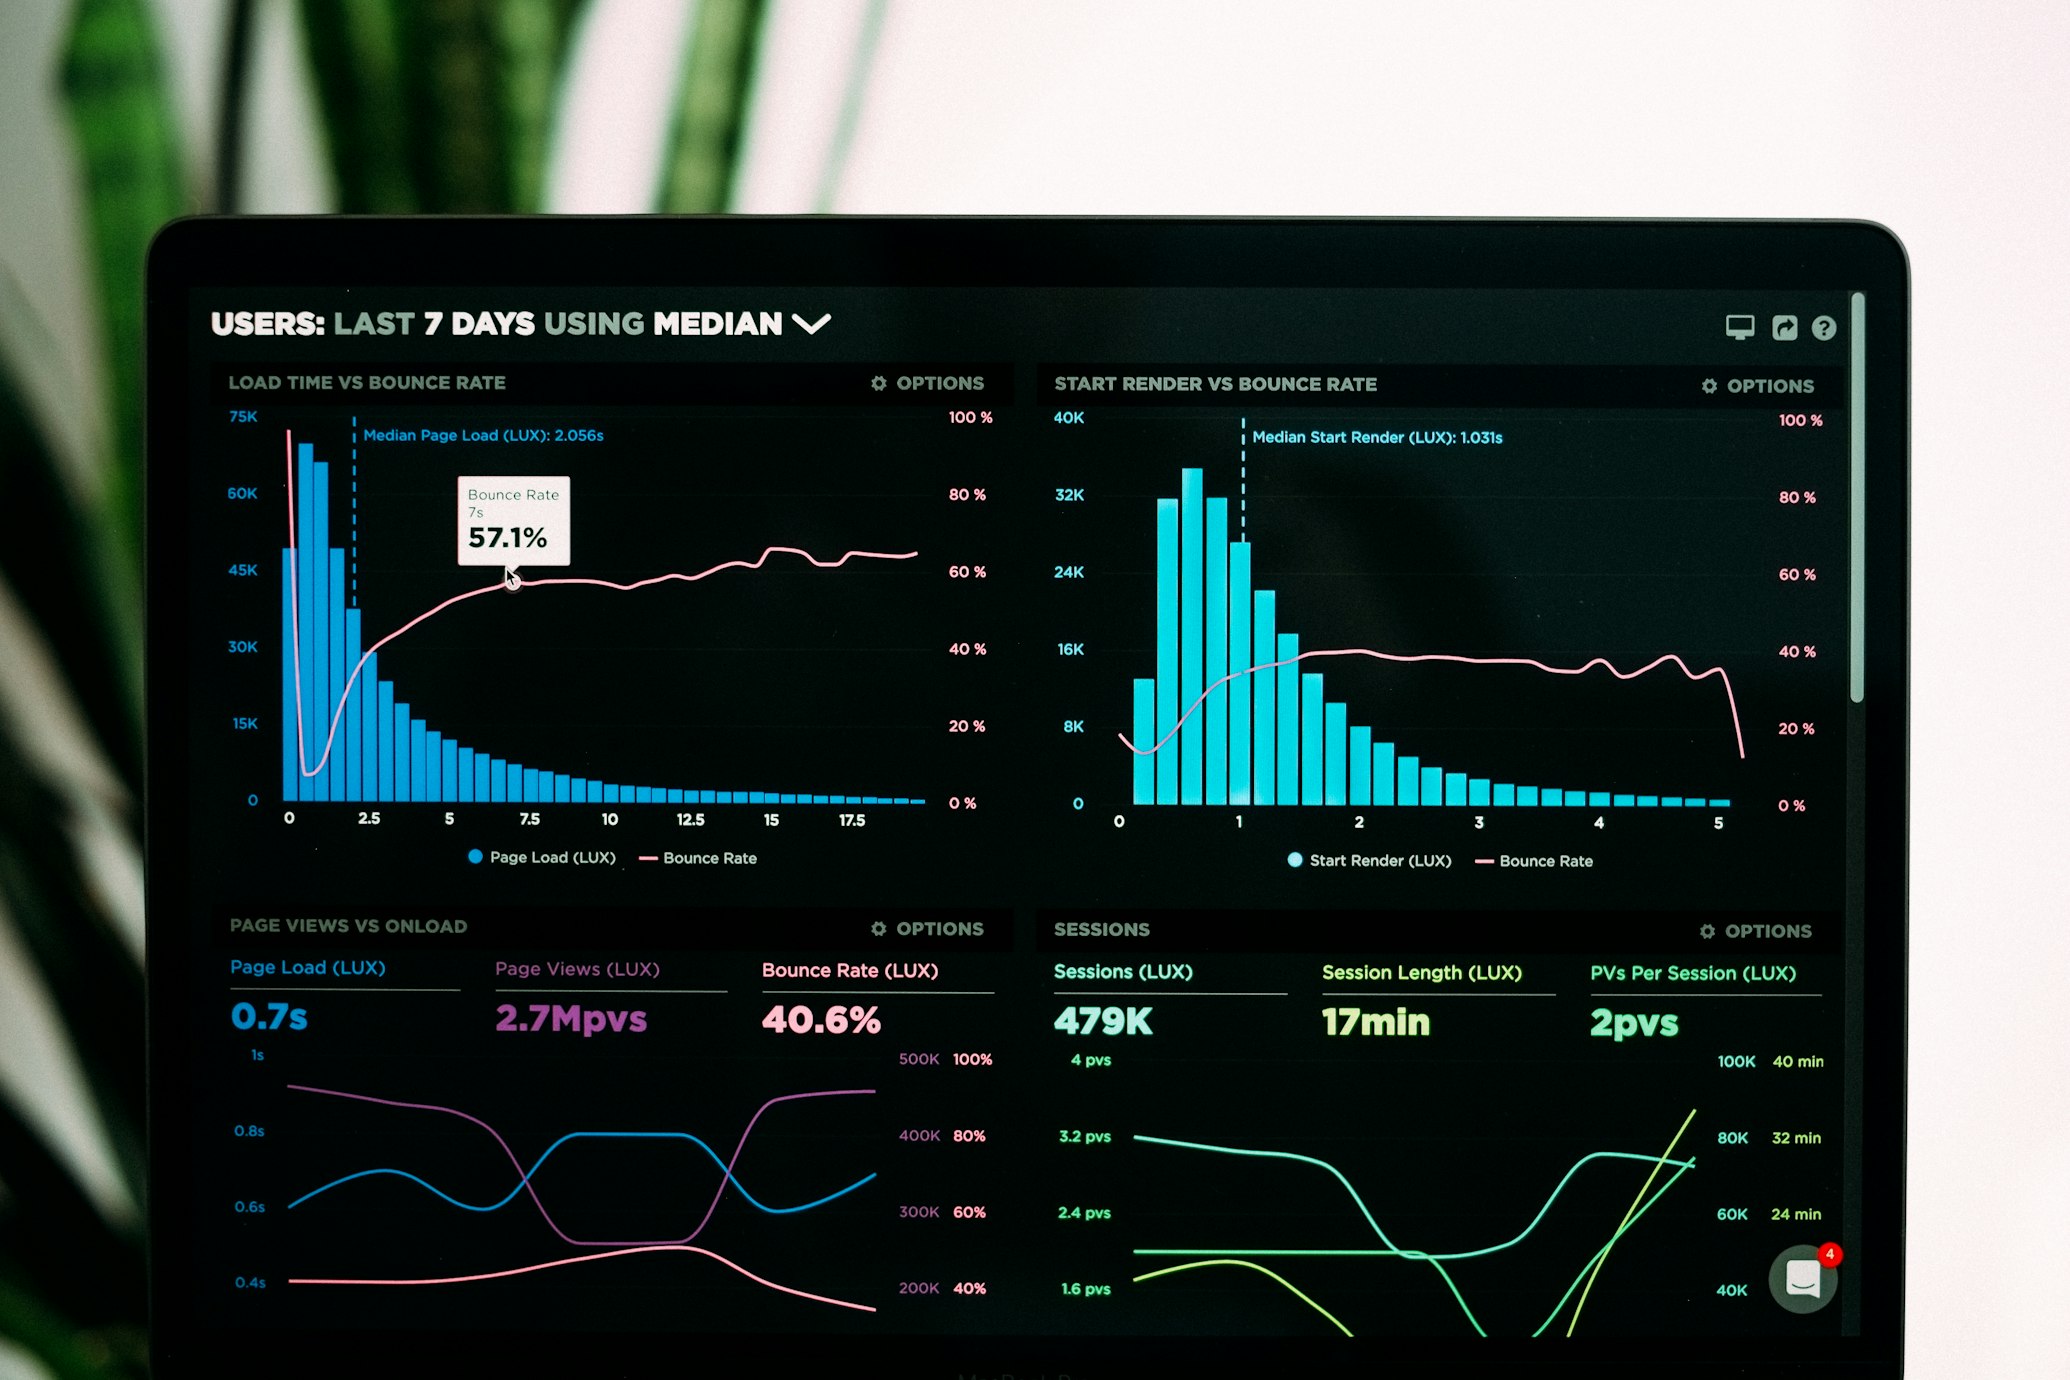
Real-time Data Processing with Inversion
Learn how to build real-time data processing pipelines with Inversion, handle streaming data, and implement event-driven architectures.
Introduction
Real-time data processing is essential for applications that need to analyze and respond to data as it's generated. In this tutorial, we'll build a complete real-time processing pipeline using Inversion that ingests streaming data, processes it on-the-fly, and visualizes the results in real-time.
By the end of this tutorial, you'll have a fully functional real-time data processing system that can:
- Ingest data from streaming sources like Kafka or Kinesis
- Process and transform data in real-time
- Detect anomalies and trigger alerts
- Visualize results on a live dashboard

Prerequisites
Before you begin, make sure you have the following:
- An Inversion account (sign up at inversion.ai if you don't have one)
- Inversion CLI installed (see Installation Guide)
- Basic familiarity with data processing concepts
- A data source for streaming data (we'll provide sample data if you don't have one)
Setting Up Your Environment
First, let's set up our project environment. Create a new directory for your project and initialize it:
mkdir real-time-processing
cd real-time-processing
inversion init --template streaming
This will create a new Inversion project with a streaming template, which includes the basic structure for a real-time processing pipeline.
Next, let's install the required dependencies:
inversion install @inversion/streaming @inversion/visualization
Configuring Data Sources
Now, let's configure our data source. Inversion supports various streaming data sources, including Kafka, Kinesis, and MQTT. For this tutorial, we'll use a Kafka stream.
Open the config.yaml file in your project directory and update the sources section:
sources:
  - name: kafka-stream
    type: kafka
    config:
      bootstrap.servers: kafka.example.com:9092
      group.id: inversion-processor
      auto.offset.reset: earliest
      topics:
        - sensor-data
If you don't have a Kafka cluster, you can use Inversion's built-in simulator for testing:
sources:
  - name: simulated-stream
    type: simulator
    config:
      frequency: 10  # events per second
      schema:
        type: object
        properties:
          sensor_id:
            type: string
          temperature:
            type: number
            min: 0
            max: 100
          pressure:
            type: number
            min: 900
            max: 1100
          timestamp:
            type: timestamp
Creating a Processing Pipeline
Now, let's define our processing pipeline. Create a new file called pipeline.js in your project directory:
const { Pipeline } = require('@inversion/core');
const { KafkaSource, SimulatorSource } = require('@inversion/streaming');
const { Dashboard } = require('@inversion/visualization');

// Create a new pipeline
const pipeline = new Pipeline({
  name: 'real-time-processor',
  description: 'Real-time sensor data processing pipeline',
});

// Add data source (use either Kafka or Simulator)
// For Kafka:
// const source = new KafkaSource('kafka-stream');
// For Simulator:
const source = new SimulatorSource('simulated-stream');

// Add the source to the pipeline
pipeline.addSource(source);

// Add a dashboard for visualization
const dashboard = new Dashboard({
  name: 'sensor-dashboard',
  port: 3000,
});

pipeline.addSink(dashboard);

// Export the pipeline
module.exports = pipeline;
Implementing Transformations
Now, let's add some transformations to our pipeline. We'll create a new file called transformations.js:
const { Transform } = require('@inversion/core');

// Temperature conversion transformation
class TemperatureConverter extends Transform {
  process(event) {
    // Convert Celsius to Fahrenheit
    if (event.temperature) {
      event.temperature_f = (event.temperature * 9/5) + 32;
    }
    return event;
  }
}

// Anomaly detection transformation
class AnomalyDetector extends Transform {
  constructor() {
    super();
    this.thresholds = {
      temperature: 90,  // Celsius
      pressure: 1050,   // hPa
    };
  }

  process(event) {
    // Check for anomalies
    event.anomalies = [];

    if (event.temperature > this.thresholds.temperature) {
      event.anomalies.push('high_temperature');
    }

    if (event.pressure > this.thresholds.pressure) {
      event.anomalies.push('high_pressure');
    }

    // Add an anomaly flag for easier filtering
    event.has_anomaly = event.anomalies.length > 0;

    return event;
  }
}

// Enrichment transformation
class Enricher extends Transform {
  process(event) {
    // Add timestamp if not present
    if (!event.timestamp) {
      event.timestamp = new Date().toISOString();
    }

    // Add processing metadata
    event.metadata = {
      processed_at: new Date().toISOString(),
      processor_id: 'real-time-tutorial',
      version: '1.0.0',
    };

    return event;
  }
}

module.exports = {
  TemperatureConverter,
  AnomalyDetector,
  Enricher,
};
Now, let's update our pipeline.js file to include these transformations:
const { Pipeline } = require('@inversion/core');
const { KafkaSource, SimulatorSource } = require('@inversion/streaming');
const { Dashboard } = require('@inversion/visualization');
const { TemperatureConverter, AnomalyDetector, Enricher } = require('./transformations');

// Create a new pipeline
const pipeline = new Pipeline({
  name: 'real-time-processor',
  description: 'Real-time sensor data processing pipeline',
});

// Add data source (use either Kafka or Simulator)
// For Kafka:
// const source = new KafkaSource('kafka-stream');
// For Simulator:
const source = new SimulatorSource('simulated-stream');

// Add the source to the pipeline
pipeline.addSource(source);

// Add transformations
pipeline.addTransform(new Enricher());
pipeline.addTransform(new TemperatureConverter());
pipeline.addTransform(new AnomalyDetector());

// Add a dashboard for visualization
const dashboard = new Dashboard({
  name: 'sensor-dashboard',
  port: 3000,
});

pipeline.addSink(dashboard);

// Export the pipeline
module.exports = pipeline;
Monitoring and Alerts
Let's add monitoring and alerts to our pipeline. Create a new file called alerts.js:
const { Transform } = require('@inversion/core');
const { EmailNotifier, SlackNotifier } = require('@inversion/notifications');

// Alert manager transformation
class AlertManager extends Transform {
  constructor() {
    super();

    // Create notifiers
    this.emailNotifier = new EmailNotifier({
      to: 'alerts@example.com',
      subject: 'Sensor Anomaly Detected',
    });

    this.slackNotifier = new SlackNotifier({
      webhook: 'https://hooks.slack.com/services/YOUR/SLACK/WEBHOOK',
      channel: '#alerts',
    });

    // Track alert state to prevent alert storms
    this.alertState = new Map();
    this.cooldownPeriod = 5 * 60 * 1000; // 5 minutes
  }

  process(event) {
    // Only process events with anomalies
    if (!event.has_anomaly) {
      return event;
    }

    const sensorId = event.sensor_id;
    const now = Date.now();

    // Check if we're in a cooldown period for this sensor
    if (this.alertState.has(sensorId)) {
      const lastAlertTime = this.alertState.get(sensorId);
      if (now - lastAlertTime < this.cooldownPeriod) {
        // Still in cooldown, don't send another alert
        return event;
      }
    }

    // Send alerts
    this.sendAlerts(event);

    // Update alert state
    this.alertState.set(sensorId, now);

    return event;
  }

  sendAlerts(event) {
    const message = `Anomaly detected for sensor ${event.sensor_id}:
- Temperature: ${event.temperature}°C (${event.temperature_f}°F)
- Pressure: ${event.pressure} hPa
- Anomalies: ${event.anomalies.join(', ')}
- Timestamp: ${event.timestamp}
`;

    // Send email notification
    this.emailNotifier.notify(message);

    // Send Slack notification
    this.slackNotifier.notify({
      text: 'Sensor Anomaly Detected',
      blocks: [
        {
          type: 'section',
          text: {
            type: 'mrkdwn',
            text: message,
          },
        },
      ],
    });
  }
}

module.exports = {
  AlertManager,
};
Now, let's update our pipeline.js file to include the alert manager:
const { Pipeline } = require('@inversion/core');
const { KafkaSource, SimulatorSource } = require('@inversion/streaming');
const { Dashboard } = require('@inversion/visualization');
const { TemperatureConverter, AnomalyDetector, Enricher } = require('./transformations');
const { AlertManager } = require('./alerts');

// Create a new pipeline
const pipeline = new Pipeline({
  name: 'real-time-processor',
  description: 'Real-time sensor data processing pipeline',
});

// Add data source (use either Kafka or Simulator)
// For Kafka:
// const source = new KafkaSource('kafka-stream');
// For Simulator:
const source = new SimulatorSource('simulated-stream');

// Add the source to the pipeline
pipeline.addSource(source);

// Add transformations
pipeline.addTransform(new Enricher());
pipeline.addTransform(new TemperatureConverter());
pipeline.addTransform(new AnomalyDetector());
pipeline.addTransform(new AlertManager());

// Add a dashboard for visualization
const dashboard = new Dashboard({
  name: 'sensor-dashboard',
  port: 3000,
});

pipeline.addSink(dashboard);

// Export the pipeline
module.exports = pipeline;
Real-time Visualization
Now, let's configure our dashboard for real-time visualization. Create a new file called dashboard.js:
const { Dashboard, Chart, Table, Gauge, Alert } = require('@inversion/visualization');

// Create a dashboard configuration
function createDashboard() {
  const dashboard = new Dashboard({
    name: 'sensor-dashboard',
    title: 'Real-time Sensor Monitoring',
    port: 3000,
    refreshInterval: 1000, // 1 second refresh
  });

  // Add a temperature chart
  const temperatureChart = new Chart({
    title: 'Temperature Over Time',
    type: 'line',
    dataSource: {
      query: 'SELECT timestamp, temperature, temperature_f FROM stream',
      groupBy: 'sensor_id',
      windowSize: '5m', // 5 minute window
    },
    options: {
      xAxis: {
        type: 'time',
        field: 'timestamp',
      },
      yAxis: {
        title: 'Temperature',
      },
      series: [
        {
          name: 'Celsius',
          field: 'temperature',
          color: '#ff7300',
        },
        {
          name: 'Fahrenheit',
          field: 'temperature_f',
          color: '#0073ff',
        },
      ],
    },
  });

  // Add a pressure gauge
  const pressureGauge = new Gauge({
    title: 'Current Pressure',
    dataSource: {
      query: 'SELECT AVG(pressure) as avg_pressure FROM stream',
      windowSize: '1m', // 1 minute window
    },
    options: {
      min: 900,
      max: 1100,
      units: 'hPa',
      thresholds: [
        { value: 1000, color: 'green' },
        { value: 1030, color: 'yellow' },
        { value: 1050, color: 'red' },
      ],
    },
  });

  // Add an anomaly alert panel
  const anomalyAlert = new Alert({
    title: 'Anomaly Alerts',
    dataSource: {
      query: 'SELECT * FROM stream WHERE has_anomaly = true',
      limit: 10,
    },
    options: {
      refreshInterval: 5000, // 5 seconds
      severity: 'high',
      messageTemplate: 'Sensor {{sensor_id}} reported anomalies: {{anomalies}}',
      timestampField: 'timestamp',
    },
  });

  // Add a data table
  const dataTable = new Table({
    title: 'Recent Sensor Data',
    dataSource: {
      query: 'SELECT * FROM stream',
      limit: 20,
    },
    options: {
      columns: [
        { field: 'sensor_id', title: 'Sensor ID' },
        { field: 'temperature', title: 'Temperature (°C)' },
        { field: 'temperature_f', title: 'Temperature (°F)' },
        { field: 'pressure', title: 'Pressure (hPa)' },
        { field: 'timestamp', title: 'Timestamp' },
        { field: 'has_anomaly', title: 'Anomaly', type: 'boolean' },
      ],
      sortable: true,
      filterable: true,
      pagination: true,
    },
  });

  // Add widgets to the dashboard
  dashboard.addWidget(temperatureChart, { width: 8, height: 4 });
  dashboard.addWidget(pressureGauge, { width: 4, height: 4 });
  dashboard.addWidget(anomalyAlert, { width: 12, height: 3 });
  dashboard.addWidget(dataTable, { width: 12, height: 6 });

  return dashboard;
}

module.exports = {
  createDashboard,
};
Now, let's update our pipeline.js file to use this dashboard configuration:
const { Pipeline } = require('@inversion/core');
const { KafkaSource, SimulatorSource } = require('@inversion/streaming');
const { TemperatureConverter, AnomalyDetector, Enricher } = require('./transformations');
const { AlertManager } = require('./alerts');
const { createDashboard } = require('./dashboard');

// Create a new pipeline
const pipeline = new Pipeline({
  name: 'real-time-processor',
  description: 'Real-time sensor data processing pipeline',
});

// Add data source (use either Kafka or Simulator)
// For Kafka:
// const source = new KafkaSource('kafka-stream');
// For Simulator:
const source = new SimulatorSource('simulated-stream');

// Add the source to the pipeline
pipeline.addSource(source);

// Add transformations
pipeline.addTransform(new Enricher());
pipeline.addTransform(new TemperatureConverter());
pipeline.addTransform(new AnomalyDetector());
pipeline.addTransform(new AlertManager());

// Add the dashboard
const dashboard = createDashboard();
pipeline.addSink(dashboard);

// Export the pipeline
module.exports = pipeline;
Running the Pipeline
Now that we have our pipeline set up, let's run it:
inversion start
This will start your real-time processing pipeline. You can access the dashboard at http://localhost:3000.

Conclusion
Congratulations! You've built a complete real-time data processing pipeline with Inversion. This pipeline:
- Ingests streaming data from Kafka or a simulator
- Processes and transforms the data in real-time
- Detects anomalies and sends alerts
- Visualizes the results on a real-time dashboard
This tutorial covered the basics of real-time processing with Inversion. You can extend this pipeline by:
- Adding more complex transformations
- Implementing machine learning models for advanced anomaly detection
- Connecting to additional data sources and sinks
- Customizing the dashboard with more visualizations
Next Steps
Ready to take your real-time processing skills to the next level? Check out these advanced tutorials:
Related Tutorials
Event-Driven Architecture
Build event-driven systems with Inversion's streaming capabilities.
Read More →